
Putting 20 years and two-and-a-half property cycles across Europe into one chart?
There are two good reasons to execute this analysis:
While the length, shape and depth of each cycle varied by sector and market, there are some key similarities that are valuable leads for investments in today’s environment. Aside from that it is also a great chart.
What are we looking at?
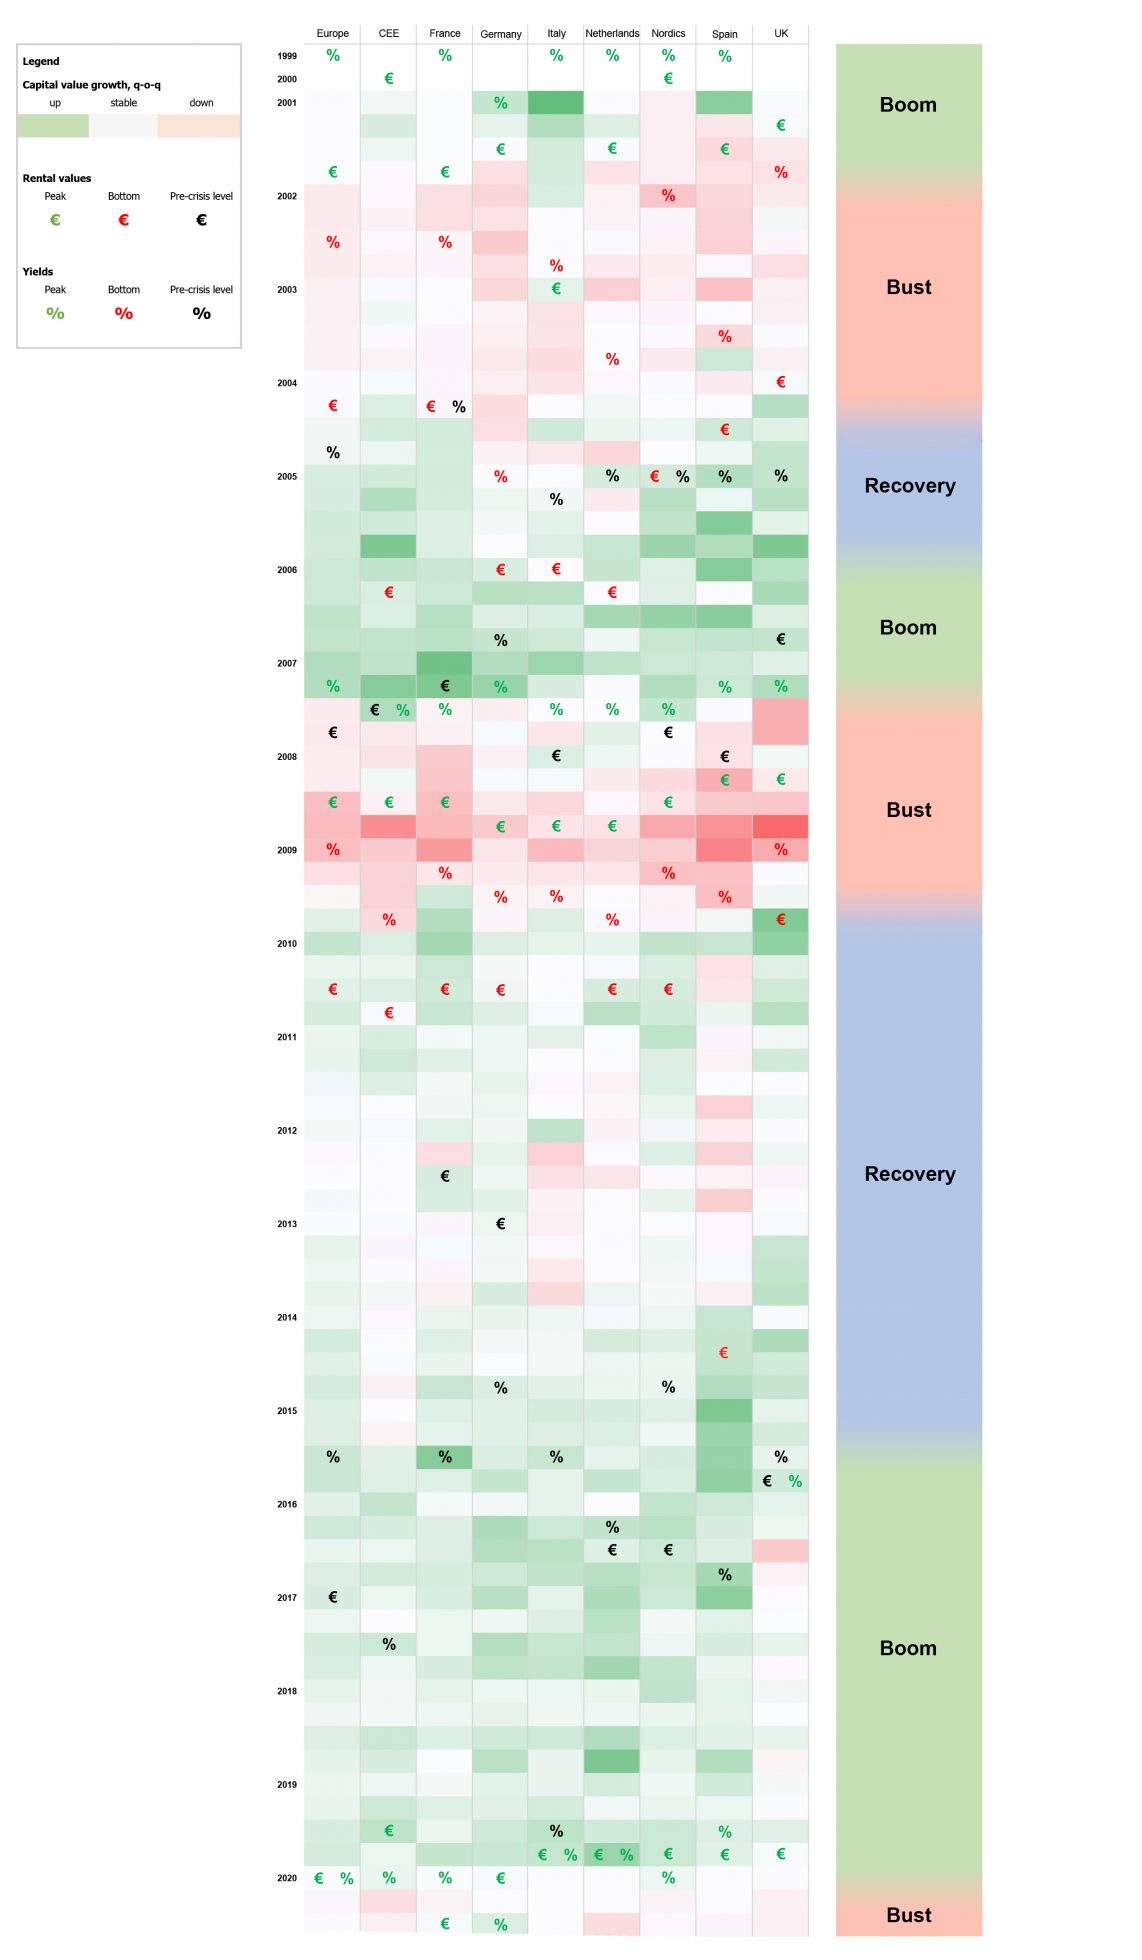
Using PMA data, the chart is displaying three layers:
Prime rental values, which reflect the income side of the property market; prime net initial yields, the capital market side, and prime capital values, the combination of the two. I have highlighted three incidences for each cycle and segment. The peak of a market (green symbols), the trough of the market (red symbols) and the return to the pre-crisis level (black symbols). Using the colour shading of the cells, I am indicating by how much prime capital values were rising or falling. Lastly, I have indicated initial market phases of booms, where former capital value peaks are exceeded, busts, where the market is correcting, and recoveries, where values return to former peaks.

If history is any guidance
Clearly, all economic cycles have been different in terms of their triggers, their inherent occurrences and their impact on individual property markets. So, the extent and the amplitude can differ substantially by market.
To call out one example: Look at Germany in comparison to most European countries. During the dot.com bust, it suffered longer capital value declines than the rest of Europe because yields barely reached the pre-crisis level of 5.1% in Q3 2006, while rents did not recover to the 2001 high during that cycle at all. This was the result a variety of factors but most importantly an excessive development pipeline which met a weak economy, hence property demand. Germany was coined ‘the sick man of Europe’ in economic terms at the time . It created a severe supply-demand imbalance depressing German rents and property values.
During the recovery following the Great Financial Crisis (GFC), however, Germany was – and still is – one of the outperformers in Europe. This is the result of a muted development pipeline (caused by the former overbuilding) in combination with stronger economic growth, which was fostered, among others, by 2003-2005’s labour market and economic reforms ‘Agenda 2010 .
These cyclical variations are based on national fundamentals. Clearly, there are equally relevant fundamental drivers at a market and submarket level that determine local cycles, which are ultimately crucial for successful investments.
However, there are some key take-aways that the last 20 years of commercial property in Europe can teach us even at an aggregate level.
Capital markets are more aligned than the income side
Capital flows and investments have become entirely global over the last 25 years or so. Therefore liquidity, pricing, risk perception and sentiment are relatively aligned among investors. This results in a fairly similar yield pattern across Europe’s office investment market. While there are leaders and laggards, yield peaks and troughs tend to be concentrated around certain dates. In the GFC recession, for example, the low point in yields differed by as little as one quarter and the subsequent maximum yield level was within a time window of four quarters.
Markets’ yield development becomes more diverse in the recovery phase. Here, some markets are leaders (France in dot.com, Germany and Nordics in GFC cycle) and some markets are laggards (Germany in dot.com, Southern and Eastern Europe in GFC) in returning to the pre-crisis levels.
Still, there is a certain pattern to the yield cycle across markets. This is much more diverse for the rental value side. Here variation at peak and trough timing can amount to years and the recovery and boom phases are particularly heterogenous. Following the GFC trough, it took Germany ten quarters and France eight quarters to return to the pre-crisis high, while in Europe on average it took 26 quarters with CEE and Spain never returning to 2007’s peaks.
Corrections tend to last two to three years
Acknowledging that cycles differ locally, it is worth analysing the typical length of yield decompression and rental declines.
On average in Europe it lasted six to eight quarters for prime yields to correct and hit bottom. There are variations, with the Netherlands, for example being as quick as four quarters during dot.com while it lasted 16 in Germany.
For rents, the correction tends to be longer, lasting on average 9 to 10 quarters in Europe. Here, the variance across countries is much larger though, as explained above. Therefore, to achieve excess returns, counter-cyclical investing in a downturn needs to consider both the yield as well as the income side, while the latter much more depends on market and property related aspects.
An investor in Madrid, for example, could have bought a prime office property for a yield of 6.0% as early as Q3 2009, while rents hit bottom as late as Q3 2014. So, a loss in value and a lasting overrent situation would have been the consequence of getting in too early.
Overall, looking at capital values, prime offices tend to take nine to ten quarters to fully correct and reach a trough in values. The shape of the downturn differed over the last 20 years. While dot.com declines were mostly front-loaded, during GFC it was the second half of the downturn which was more severe.
Applying this time period to the COVID-cycle, or ‘the Great Lockdown’, would theoretically take us to mid-2022 for values to hit bottom. That said, so far values have only moved minimally for prime properties. In fact, markets perceived as lower risk, like Germany, have experienced a continuation of rising values as investor demand remained high.
This time it’s different… Don’t expect a cycle to pan out as the last one.
While it is right and important to look for similarities to predict a cycle’s shape, clearly it is equally important to analyse the differences in each cycle. Strikingly obvious is the length of cycles looking back. The recovery and boom phase of the GFC lasted a total of 42 quarters in Europe, while the upswing following dot.com was only 12.
Besides the length of a cycle, the amplitude of value declines and gains is crucial. For example, prime office values in Europe have fallen just above 20% following dot.com but 30% as a result of the GFC, while the duration of the correction was similar.
What is fundamentally different in this recession so far is that there have hardly been movements at the yield side of things. Historically, yields have corrected very quickly in a downturn, anticipating and preceding rental value declines. In today’s ultra-accommodating interest rate environment, however, core properties, which are seen as an alternatives to fixed income products, are attracting investors’ attention and a lot of liquidity.
It therefore is likely that COVID’s impact on prime or core property will be less than it was in previous cycles. However, if the income side was to suffer to a larger extent than what we have seen so far, it is likely that yields, and hence pricing, will have to adjust more pronounced than largely anticipated. Here the fundamental economic development during 2021 will be the decisive factor. Given some issues that are being carried over from 2020 into this year, like deferred insolvency and expiring short-term-work schemes, economic risks remain on the downside in 2021.
Where does all that leave us with the COVID-cycle
To put the last 20 years in a nutshell.
It typically takes nine to ten quarters for office markets to correct in a downturn. This would take us to mid-2022.
The occupational market is slower to react to economic woes than the yield side and significantly more diverse in a recovery. Given the larger relevance of the income side in this cycle, it is likely that value corrections occur ‘back-loaded’.
As the income side is decisive in this cycle, in-depth submarket and asset specific analyses are crucial for successful investments.
The extent of any property market correction, however, depends on the further development of the COVID-pandemic, which has proven to be very difficult to predict. Therefore ‘scenario thinking’ will remain key in 2021.
Data source: PMA | 1 See, for example the Economist, “The sick man of the euro”, June 3rd 1999 | 2 See, for example, Deutsche Welle, “The labor reforms that set off a boom”, Dec 31st 2014
DISCLAIMER
This document has been prepared for general information purposes only. It does not constitute an offer or invitation to sell or issue, or to purchase or subscribe any shares in funds, securities or financial instruments, or any other shareholdings in or distributed by CORESTATE Capital Holding S.A. or any other company of the CORESTATE Capital Group (hereafter collectively referred to as the “Company”). No part of this document nor the fact of its distribution be or form part of or be relied on in connection with any contract or investment decision relating thereto, nor does it constitute a recommendation regarding the securities or the shares in funds or other financial instruments of the Company or of another entity. Therefore, this cannot be deemed as financial services, investment advisory services, an offer for the acquisition of a financial instrument or general investment advice, legal or tax advice.
The data and information contained herein has been obtained from various sources is believed to be reliable and accurate. All data and information derive from sources which the Company believes to be reliable. Furthermore, the Company has used its best endeavors to ensure that the presented facts and opinions are adequate and correct. Forward-looking statements and statements are based on current estimates, expectations and forecasts of the Company regarding market and industry developments at the time of preparation.
Nevertheless, no reliance may be placed for any purposes on the information contained in this document or on its completeness, accuracy or fairness. Neither the Company nor any of its directors, officers or employees or any other person makes any warranty or gives any guarantee, neither express nor implied, as to the accuracy or completeness of the information contained in this document, and accepts no liability for loss or damage of any kind in connection with this document, unless caused by gross negligence or intent of the Company and unless standing in a causal connection to the potential damage. The information is subject to change at any time (even without notification to the recipients). This document is an advertisement and not a financial analysis or a prospectus. The information and opinions expressed in this document are provided as of the date of this document. Certain statements, beliefs and opinions in this document, are forward-looking, which reflect the Company’s or, as appropriate, the Company’s directors’ current expectations and projections about future events. By their nature, forward-looking statements involve a number of risks, uncertainties and assumptions that could cause actual results or events to differ materially from those expressed or implied by the forward-looking statements. These risks, uncertainties and assumptions could adversely affect the outcome and financial effects of the plans and events described herein. Forward-looking statements contained in this document regarding past trends or activities should not be taken as a representation that such trends or activities will continue in the future. The Company does not undertake any obligation to update or revise any forward-looking statements. You should not place undue reliance on forward-looking statements, which speak only as of the date of this document. No statement in this presentation is intended to be nor may it be construed to be a profit forecast. By attending the presentation to which this document relates or by accepting a copy of this document you agree to be bound by the foregoing limitations and, in particular that you have read and agreed to comply with the contents of this notice.
This presentation has been compiled by Corestate Capital Investors (Europe) GmbH, a company of the CORESTATE Capital Group, 19.05.2020.
